Introduction
Manufacturing companies face significant inventory management challenges, with working capital tied up in inventory representing 20-25% of total assets according to the Manufacturing Institute. Yet many don’t track their inventory turnover ratio properly. Recent analysis of over 200 manufacturing companies using Controlata reveals a critical insight: products turn over 1.6 times faster than raw materials, yet most manufacturers apply the same inventory strategies to both.
The inventory turnover ratio measures how many times inventory is sold and replaced during a specific period. For manufacturers with significant capital tied up in raw materials, work-in-progress, and finished goods, optimizing this metric can dramatically improve cash flow and operational efficiency.
Research from McKinsey & Company shows that companies with optimized inventory management achieve 15-25% better working capital efficiency compared to industry averages.
In this guide, we’ll reveal data-driven insights from real manufacturing operations, industry benchmarks based on actual performance data, and specific improvement strategies that have proven successful across different manufacturing sectors.
Understanding Inventory Turnover Ratio
Inventory turnover ratio measures how quickly a manufacturing company converts inventory into sales during a given period. This ratio indicates how many times a company’s inventory is sold and replaced over a specific timeframe—typically a year.
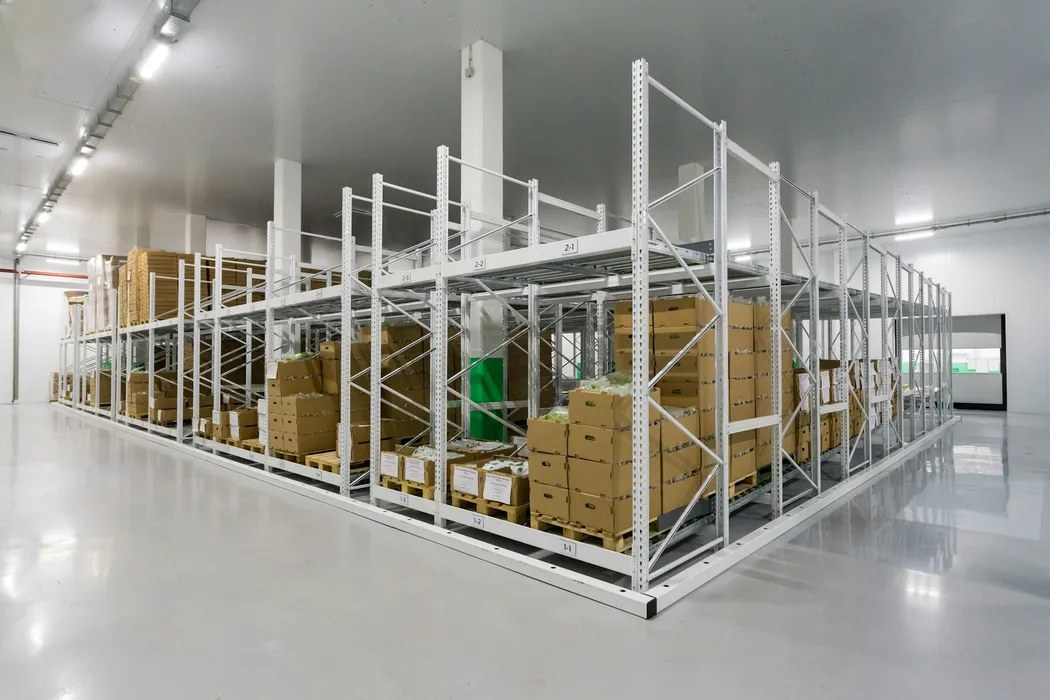
For manufacturing companies, this metric is particularly critical because inventory often represents 25-40% of total assets on the balance sheet. Unlike retail businesses that primarily manage finished goods, manufacturers must track and optimize three distinct inventory categories:
- Raw materials: Components and inputs required for production
- Work-in-progress (WIP): Partially completed products
- Finished goods: Completed products ready for sale
The Two-Speed Reality
Analysis of manufacturing operations using Controlata reveals what we call the “Two-Speed Rule”: finished products consistently turn over 1.6 times faster than raw materials across all industries. This finding challenges the traditional approach of applying uniform inventory strategies.
Why This Happens:
- Raw materials often require bulk purchasing for price advantages
- Finished goods face immediate market pressure for turnover
- Production scheduling drives material stockpiling
- Customer demand directly impacts finished goods velocity
This insight means manufacturers need separate optimization strategies for materials versus products, rather than treating all inventory the same way.
Calculation Methods for Inventory Turnover Ratio

Calculating inventory turnover ratio accurately requires understanding which method provides the most actionable insights for your specific manufacturing context.
Standard Method: COGS / Average Inventory
The most widely accepted formula is:
Inventory Turnover Ratio = Cost of Goods Sold (COGS) / Average Inventory
This method is preferred for manufacturing because it uses cost value rather than sales price, providing a more accurate picture of inventory movement.
Step-by-step calculation process:
- Extract COGS from your income statement for the measurement period
- Calculate average inventory: (Beginning Inventory + Ending Inventory) ÷ 2
- Apply the formula: COGS ÷ Average Inventory
- Convert to days: 365 ÷ Turnover Ratio = Days to turn inventory
Practical Example:
- COGS: $5,000,000 annually
- Beginning inventory: $800,000
- Ending inventory: $1,200,000
- Average inventory: $1,000,000
- Turnover ratio: 5.0 (turns over 5 times per year)
- Days Sales of Inventory: 73 days
Try Controlata
- Manufacturing inventory management
- Cost calculation
- Production planning
- And much more

Advanced Analysis: Separate Material and Product Calculations
Based on the two-speed principle, calculate separate ratios:
Materials Turnover:
Materials Used in Production ÷ Average Raw Materials Inventory
Products Turnover:
COGS ÷ Average Finished Goods Inventory
This granular approach reveals where your biggest optimization opportunities exist and allows for targeted improvement strategies.
Real Manufacturing Data: Industry Performance Benchmarks
Understanding how your inventory turnover compares to actual industry performance provides crucial context. Based on analysis of manufacturing operations using Controlata across different sectors, here are the real-world benchmarks:
Product Turnover by Industry (Days Sales of Inventory)
| Industry | Average Days | Annual Turns | Performance Tier |
|---|---|---|---|
| Clothing & Footwear | 73 days | 5.0 turns | Fast |
| Candles & Fragrances | 150 days | 2.4 turns | Fast |
| Children’s Products | 197 days | 1.9 turns | Fast |
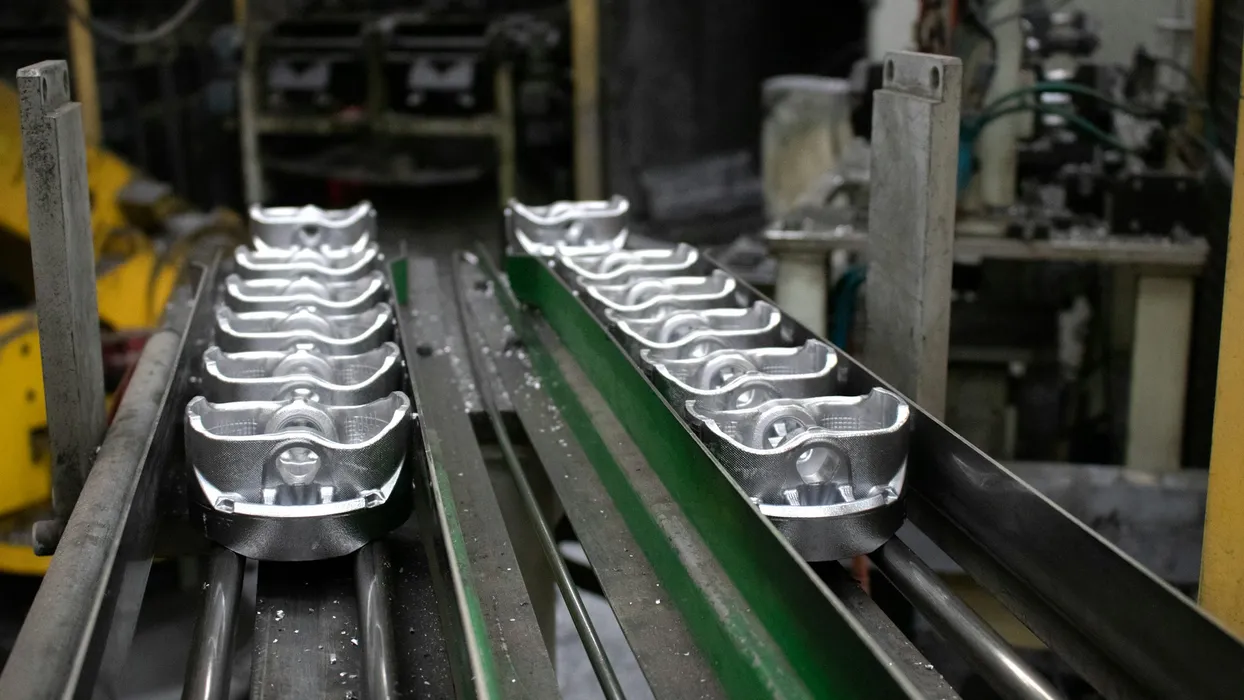
| Metalworking | 365 days | 1.0 turns | Standard |
| Beauty & Health | 461 days | 0.8 turns | Slow |
Key Insights from the Data
Industry Variability is Extreme: Data from Controlata’s manufacturing customers shows products demonstrate a 6.3x difference between fastest and slowest industries (73 vs 461 days), while materials show only a 2.2x difference. This means:
- Product inventory strategies must be industry-specific
- Material strategies can be more standardized across industries
- One-size-fits-all approaches don’t work for finished goods
The Business Size Effect: Analysis of Controlata users reveals larger manufacturing teams achieve significantly better product turnover:
- Single-person operations: 345 days (1.1 turns)
- Small teams (2-10 people): 212 days (1.7 turns)
- Improvement: 63% faster turnover with team growth
According to the Council of Supply Chain Management Professionals, this improvement comes from better demand forecasting, specialized roles, and systematic inventory processes that small teams can implement.
Interpreting Your Manufacturing Performance
Benchmarking Your Results
Compare your performance using this framework:
For Product Inventory:
- Excellent: Top 20% of your industry benchmark
- Good: Within 10% of industry average
- Needs Improvement: 20%+ below industry average
- Critical: 40%+ below industry average
For Material Inventory:
- Target range: 200-300 days (based on aggregate data)
- Consider your industry’s material complexity
- Factor in supplier reliability and lead times
Warning Signs in Manufacturing Operations
Too-Low Turnover Indicators:
- Cash conversion cycle exceeding 90 days
- Storage costs above 15% of inventory value annually
- More than 10% of inventory aging beyond 12 months
- Frequent write-offs for obsolete materials
Too-High Turnover Red Flags:
- Stockout frequency above 5% monthly
- Emergency purchasing costs exceeding 3% of material spend
- Production delays due to material shortages
- Customer order fulfillment rate below 95%
The Goldilocks Zone: Optimal turnover balances carrying costs with service levels. For most manufacturers, this means maintaining 95%+ order fulfillment while keeping inventory-related costs under 20% of total inventory value.
Common Manufacturing Inventory Challenges

Real manufacturing operations face specific challenges that directly impact inventory turnover performance. Understanding these obstacles is essential for developing effective improvement strategies.
The Material Management Complexity
Price Volatility Impact: According to Bureau of Labor Statistics data, commodity prices can fluctuate 30-50% annually, forcing manufacturers to choose between price speculation and inventory optimization. This volatility adds an average of 45 days to material turnover cycles.
Minimum Order Quantity Traps: Suppliers often require minimum orders that exceed monthly usage by 3-6x, automatically reducing turnover ratios. The solution involves supplier consolidation and negotiating quantity flexibility based on annual commitments.
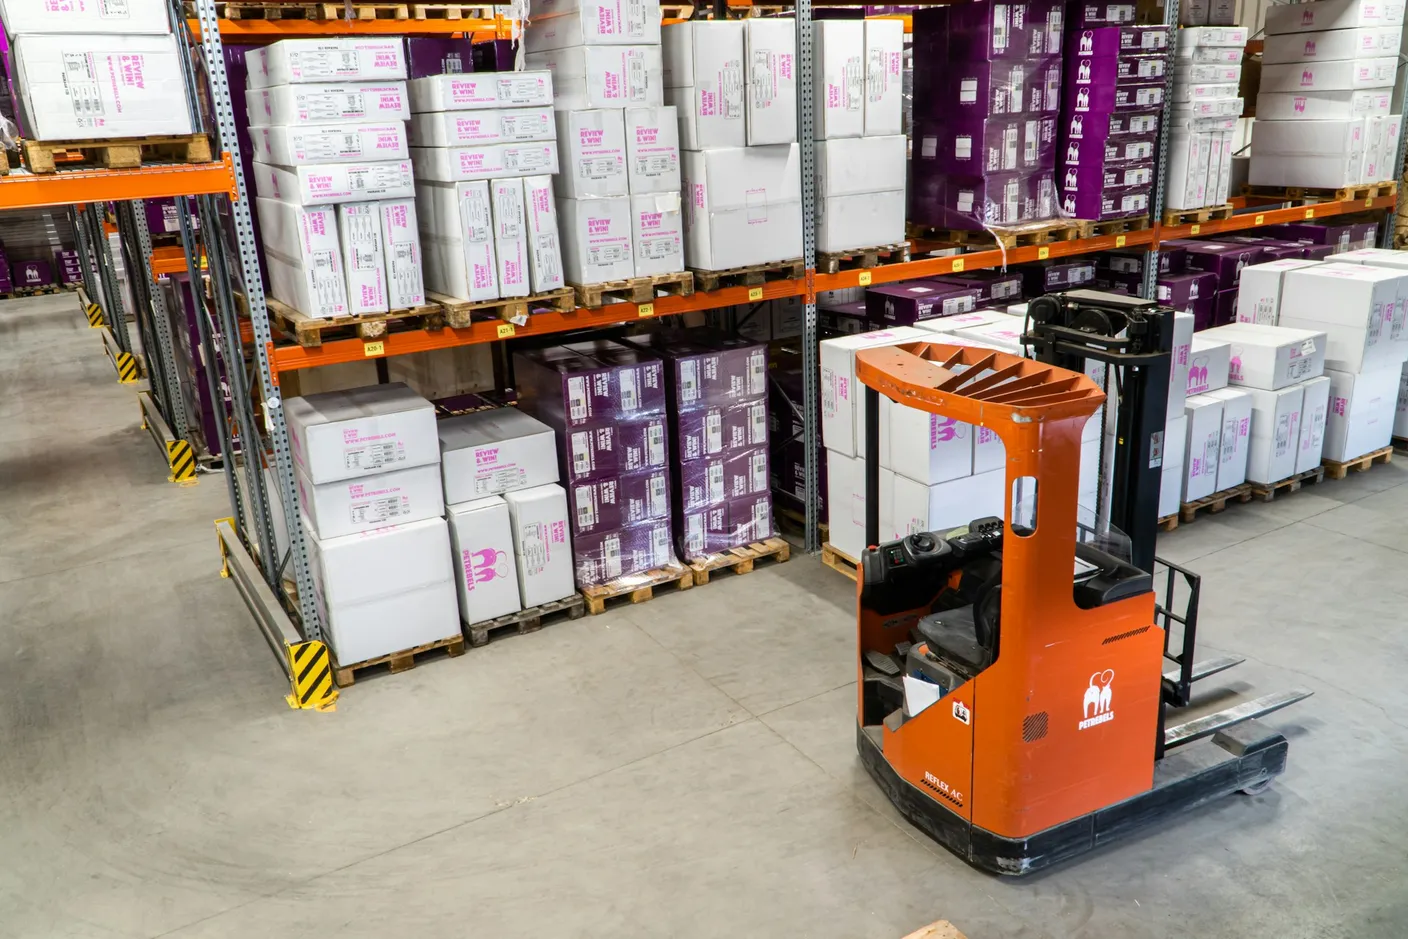
Work-in-Progress (WIP) Bottlenecks
The Hidden Inventory Killer: WIP inventory often represents 30-50% of total inventory value but receives the least management attention. Common WIP issues include:
- Production bottlenecks: Single-point failures creating upstream accumulation
- Batch processing inefficiencies: Large batches optimized for setup time rather than flow
- Quality holds: Items awaiting inspection that create stagnant inventory pools
Technology and Visibility Gaps
Information Silos: Research from Deloitte’s Manufacturing Industry Outlook shows the average manufacturer uses 4-7 different systems for inventory management, creating data inconsistencies and visibility gaps. Companies with integrated inventory visibility achieve 25% better turnover ratios.
Manual Process Inefficiencies: Spreadsheet-based tracking creates 2-5 day information lags, making real-time optimization impossible. This delay alone can reduce turnover performance by 15-20%.
Proven Strategies to Improve Inventory Turnover
1. Implement the Two-Speed Strategy
For Raw Materials (Target: Reduce by 15-25%):
- Negotiate flexible ordering: Establish annual contracts with monthly call-offs
- Supplier consolidation: Reduce supplier base by 30-40% to increase individual order volumes
- Economic order quantity optimization: Calculate EOQ monthly rather than annually to adapt to usage changes
For Finished Products (Target: Reduce by 25-40%):
- Demand-driven production: Implement weekly S&OP cycles tied to actual customer orders
- Product mix optimization: Focus production on items with turnover above industry median
- Customer collaboration: Establish vendor-managed inventory with top 20% of customers
2. Advanced Demand Forecasting Implementation
Statistical Approach:
- Use 13-week rolling forecasts updated weekly with actual sales data
- Apply exponential smoothing with alpha values between 0.1-0.3 for stable demand
- Implement seasonal indices calculated from 3+ years of historical data
Collaborative Planning:
- Monthly demand review meetings with sales teams
- Customer forecast sharing for accounts representing 60%+ of revenue
- Market intelligence integration from trade associations and industry reports
3. Production Optimization Tactics
Reduce Setup Times:
- Target 50% setup time reduction through SMED (Single-Minute Exchange of Dies) methodology
- Implement visual setup procedures with standardized tool placement
- Cross-train operators on multiple equipment types to increase flexibility
Flow Enhancement:
- Map value streams for top 80% of products by volume
- Eliminate non-value-adding inventory between production steps
- Implement cellular manufacturing for product families with similar processes
4. Supplier Relationship Optimization
Performance-Based Partnerships:
- Establish supplier scorecards measuring delivery, quality, and flexibility
- Implement graduated payment terms: 2/10 net 30 for top performers, longer terms for others
- Create supplier development programs focused on delivery reliability
Strategic Sourcing:
- Develop dual sourcing for critical materials representing 20%+ of spend
- Negotiate consignment inventory for high-value, predictable usage items
- Establish supply chain visibility with tier-2 suppliers for critical components
How Manufacturing Software Improves Inventory Turnover

Modern inventory management systems designed specifically for manufacturing environments provide the real-time visibility and automated processes necessary to optimize inventory turnover ratios.
Real-Time Production Integration
Manufacturing-specific software automatically updates inventory levels as production occurs, eliminating the 2-5 day information lags common with manual systems. This real-time integration enables:
- Accurate WIP tracking across multiple production stages
- Automatic material consumption based on bill-of-materials specifications
- Production-driven reordering triggered by actual usage rather than forecasts
Advanced Analytics and Reporting
Specialized manufacturing systems provide turnover analysis that goes beyond basic calculations:
- Separate material and product turnover tracking
- Trend analysis showing improvement over time
- ABC classification with automated reordering rules
- Exception reporting for slow-moving inventory
FIFO Cost Management
Proper cost management significantly impacts turnover calculations. Manufacturing systems typically include:
- Automated FIFO cost tracking for accurate inventory valuation
- Landed cost calculation including freight and handling
- Standard cost variance analysis to identify pricing trends
Multi-Location Coordination
For manufacturers with multiple facilities, specialized software provides:
- Inter-facility transfer management to optimize inventory distribution
- Consolidated inventory reporting across all locations
- Demand aggregation for better supplier negotiations
The combination of real-time data, manufacturing-specific workflows, and integrated analytics enables manufacturers to achieve the 25-40% inventory turnover improvements observed in successful implementations.
Measuring Success and Continuous Improvement
Key Performance Indicators Beyond Turnover Ratio
Track these complementary metrics to ensure balanced optimization:
Financial Metrics:
- Working capital efficiency: (Current Assets - Current Liabilities) / Revenue
- Cash conversion cycle: Days Sales Outstanding + Days Sales of Inventory - Days Payable Outstanding
- Inventory carrying cost percentage: Total carrying costs / Average inventory value
Operational Metrics:
- Order fulfillment rate: Orders shipped complete and on-time / Total orders
- Stockout frequency: Number of stockout incidents / Total line items monthly
- Forecast accuracy: 1 - (|Actual - Forecast| / Actual)
Implementation Timeline and Expectations
Month 1-2: Assessment and Planning
- Calculate current turnover ratios by category
- Benchmark against industry data
- Identify top 3 improvement opportunities
Month 3-6: Quick Wins Implementation
- Implement automated reordering for top 20% of materials
- Establish weekly production planning cycles
- Begin supplier scorecard program
Month 7-12: Systematic Improvements
- Deploy demand forecasting improvements
- Optimize production batch sizes
- Implement advanced inventory classification
Expected Results Timeline:
- 3 months: 10-15% improvement in fast-moving items
- 6 months: 20-25% overall improvement
- 12 months: 30-40% improvement with systematic approach
Conclusion and Implementation Roadmap
Optimizing inventory turnover ratio in manufacturing requires understanding the fundamental principle that products and materials behave differently and need distinct management strategies. Data from Controlata’s manufacturing customers clearly shows that successful manufacturers achieve 1.6x faster product turnover compared to materials, and industry-specific approaches can yield 6x performance differences.
Your Implementation Priority List:
- Calculate separate turnover ratios for materials and products immediately
- Benchmark against industry-specific data to identify your biggest gaps
- Implement the two-speed strategy with different optimization approaches
- Focus on demand forecasting improvements for products and supplier relationship optimization for materials
- Deploy manufacturing-specific inventory management technology to enable real-time optimization
Expected Business Impact:
- Working capital improvement: 15-30% reduction in inventory investment
- Cash flow enhancement: 25-45 day improvement in cash conversion cycle
- Profitability increase: 3-8% margin improvement through reduced carrying costs
The manufacturers achieving the best inventory turnover results share common characteristics: they use data-driven decision making, implement industry-specific strategies, and leverage technology designed specifically for manufacturing environments.
Start with measuring your current performance using the frameworks provided, then implement improvements systematically. The combination of proven strategies and proper measurement will transform your inventory from a necessary cost into a competitive advantage that directly improves your bottom line.