Overall Equipment Effectiveness (OEE): How to Calculate and Improve
Most manufacturers assume their equipment runs productively 70-80% of planned time. The reality is far more sobering: benchmark data from over 3,000 industrial machines reveals a median runtime of just 32%. This gap between perception and reality represents billions in lost manufacturing capacity globally. Overall Equipment Effectiveness (OEE) is the metric that exposes this gap and provides a roadmap to close it. As 80% of manufacturing executives plan to invest in smart manufacturing initiatives in 2026, understanding how to calculate and improve OEE has never been more critical for competitive survival.
Understanding OEE: The Manufacturing Productivity Standard
Overall Equipment Effectiveness is the gold standard for measuring manufacturing productivity. It quantifies the percentage of planned production time that actually produces quality output. An OEE score of 100% means equipment manufactured only good parts, as fast as theoretically possible, with zero unplanned downtime. In practice, 100% OEE is virtually impossible to achieve and rarely even desirable when equipment isn’t a bottleneck.
OEE works by multiplying three distinct factors, each representing a different type of production loss:
Availability
Availability measures how much time equipment actually runs compared to scheduled production time. Unplanned stops, changeovers, and breakdowns all reduce availability. Interestingly, the largest availability loss isn’t always mechanical failure. According to 2026 manufacturing benchmark data, “No Business/Orders” was the primary loss driver for 37.6% of tracked machines, accounting for over 22,700 lost hours. This means OEE exposes scheduling and demand planning gaps that traditional maintenance metrics miss entirely.
Performance
Performance evaluates whether equipment operates at its ideal speed when running. Even small slowdowns, minor stoppages, or reduced cycle speeds chip away at performance throughout a shift. A machine running at 95% of ideal speed loses 5% of potential output even when it never fully stops.
Quality
Quality tracks what percentage of produced parts meet specifications on the first pass. Scrap, rework, and defects all lower the quality score. While quality events might seem infrequent, benchmark data shows they average 142.6 minutes per occurrence, making each quality failure disproportionately expensive.
What Is a Good OEE Score?
World-class manufacturers typically achieve OEE scores above 85%. Average manufacturers hover around 60%. But these benchmarks mean little without context. A bottleneck resource demands aggressive OEE improvement, while non-bottleneck equipment might perform adequately at 65%. The key is knowing which machines matter most to overall throughput.
How to Calculate OEE: Formula and Real Example
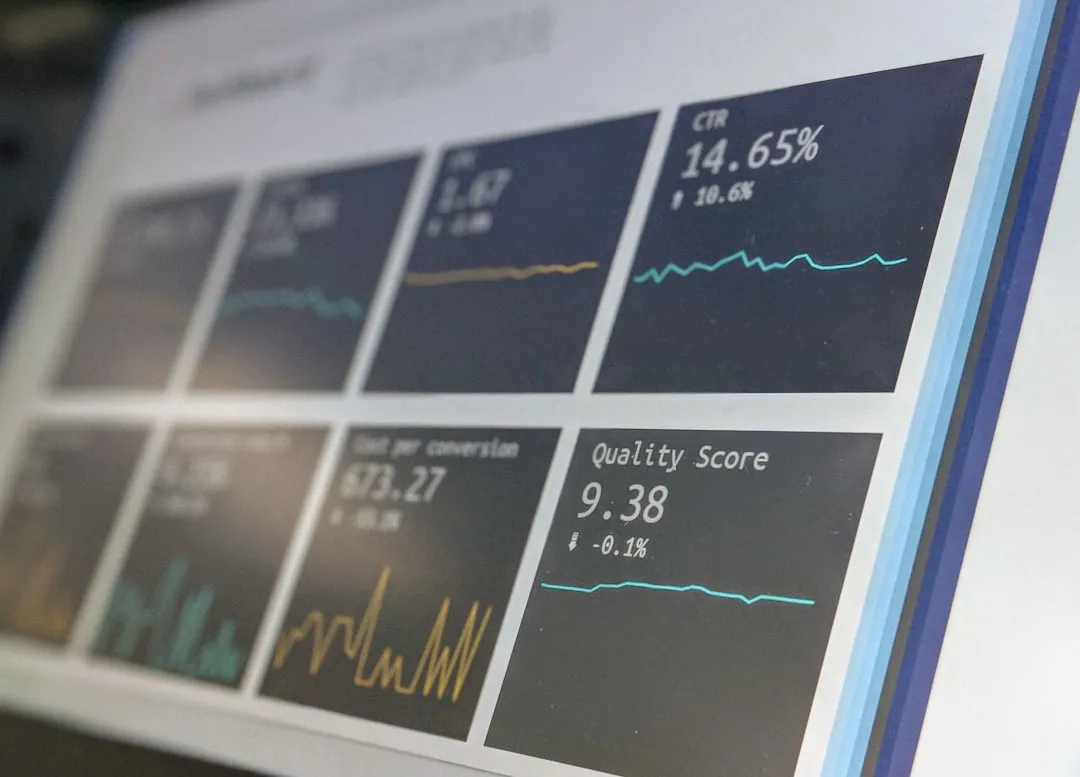
The OEE calculation multiplies three percentages to produce a single effectiveness score:
OEE = Availability × Performance × Quality
Each component requires specific data points and calculations. Here’s how to calculate each factor.
Calculating Availability
Availability = Run Time / Planned Production Time
Run Time is Planned Production Time minus all unplanned stops (breakdowns, changeovers, material shortages). Planned Production Time excludes scheduled breaks, planned maintenance, and non-production shifts. For example, if a machine is scheduled to run for 480 minutes but experiences 48 minutes of unplanned downtime, Run Time equals 432 minutes. Availability = 432 / 480 = 90%.
Calculating Performance
Performance = (Ideal Cycle Time × Total Count) / Run Time
Ideal Cycle Time is the fastest possible time to produce one unit under optimal conditions, typically determined by equipment specifications or historical best performance. Total Count is the number of units produced during the Run Time. If ideal cycle time is 0.5 minutes per unit and the machine produces 820 units in 432 minutes of run time, Performance = (0.5 × 820) / 432 = 95%.
Setting accurate ideal cycle times is critical. Underestimating inflates performance scores and masks real losses. Overestimating creates impossible targets that demoralize teams. Use actual equipment capability data, not theoretical maximums.
Calculating Quality
Quality = Good Count / Total Count
Good Count represents units that meet specifications on the first pass, requiring no rework. Total Count includes all units produced, including defects. If 820 total units were produced but only 804 meet quality standards, Quality = 804 / 820 = 98%.
Complete OEE Calculation
Using the example numbers: OEE = 0.90 × 0.95 × 0.98 = 0.838, or 83.8%
This 83.8% score might seem strong, but it reveals that 16.2% of planned production time produced no value. For a facility generating $10 million in annual revenue, that represents $1.62 million in lost capacity. Even seemingly high scores mask significant improvement opportunity.
The compounding effect is particularly important to understand. A 2% loss in availability, 3% loss in performance, and 2% loss in quality don’t simply add up to 7% total loss. They multiply: 0.98 × 0.97 × 0.98 = 0.931, meaning 6.9% loss. As losses increase, this compounding effect accelerates.
Try Controlata
- Manufacturing inventory management
- Cost calculation
- Production planning
- And much more

The Hidden Costs of Low OEE
Most manufacturers understand that low OEE means reduced output. Fewer recognize that poor equipment effectiveness creates costs far beyond obvious production losses. These hidden expenses compound over time and often exceed the direct cost of lost production.
Availability Losses Go Beyond Breakdowns
While equipment failures get immediate attention, scheduling inefficiencies often cause greater damage. The 2026 manufacturing benchmark study found that “No Business/Orders” drove 37.6% of all tracked machine losses, representing 22,715 lost hours. This reveals a critical insight: low availability scores can indicate demand planning failures, poor production scheduling, or sales pipeline problems just as easily as maintenance issues. A facility might invest heavily in reliability improvements while the real problem is insufficient order volume to keep machines running.
Performance Losses Disrupt Planning
Changeover variability emerged as a particularly damaging source of performance loss in recent benchmark data. Median changeover time across industries was 44 minutes, but variability reached 56.6%. This inconsistency makes accurate production scheduling nearly impossible. A changeover that takes 30 minutes one day and 75 minutes the next creates cascading delays, missed delivery commitments, and excess inventory buffers to protect against unpredictable lead times. The cost isn’t just the extra 45 minutes. It’s the overtime, expedited shipping, lost sales, and safety stock required to buffer the uncertainty.
Quality Failures Are Rare but Expensive
Quality and rework events represented only 3.74% of total downtime in the benchmark study, leading many manufacturers to deprioritize quality improvement. This is a costly mistake. Each quality event averaged 142.6 minutes, meaning a single defect incident consumed more time than multiple minor performance losses combined. When defects escape to customers, the cost expands exponentially to include returns, warranty claims, reputation damage, and potential contract loss.
What Low OEE Costs a $10 Million Manufacturer
Consider a mid-sized manufacturer with $10 million in annual revenue operating at 70% OEE. That 30% loss equals $3 million in theoretical capacity, which is why OEE belongs in every capacity planning calculation. But the actual business impact often exceeds this figure. The manufacturer might need to run overtime to meet commitments (premium labor costs), expedite raw materials when poor planning creates shortages (expediting fees), maintain excess inventory to buffer unreliable processes (carrying costs), and turn away new business because capacity appears constrained (opportunity cost). A focused OEE improvement program to reach 80% OEE doesn’t just recover $1 million in direct production capacity. It eliminates these cascading inefficiencies.
Five Practical Strategies to Improve OEE

Improving OEE requires systematic changes to how production runs day-to-day. These five strategies address the most common sources of lost effectiveness across manufacturing operations.
1. Get Real-Time Production Visibility
Spreadsheet-based OEE tracking fails because data arrives too late to matter. When operators manually log downtime at shift end, patterns are invisible and intervention is impossible. Automatic data collection from equipment sensors provides immediate feedback when performance degrades. Weatherables, a vinyl railing manufacturer, achieved a 12% OEE increase primarily by implementing real-time monitoring that revealed hidden inefficiencies. The visibility enabled faster staffing decisions, more responsive maintenance, and better resource allocation. Real-time data transforms OEE from a reporting metric into an action trigger.
2. Standardize Changeovers
With median changeover variability at 56.6% across industries, reducing changeover inconsistency delivers immediate OEE gains. Apply SMED (Single-Minute Exchange of Die) principles: document every changeover step, time each element, identify tasks that can occur while equipment runs (external setup), and create standard work instructions. A changeover that ranges from 30 to 90 minutes might stabilize at 35 minutes with proper standardization. This consistency not only improves performance scores but enables more accurate production scheduling and reduces inventory buffers.
3. Move to Predictive Maintenance
Reactive maintenance destroys availability. Waiting for equipment to fail guarantees unplanned downtime at the worst possible moments. Use OEE availability data to identify patterns in breakdowns and schedule preventive maintenance during planned stops. Advanced operations deploy IoT sensors to monitor vibration, temperature, and other leading indicators of failure, shifting from time-based to condition-based maintenance. This approach reduces both unplanned stops and unnecessary preventive work.
4. Make OEE Visible on the Shop Floor
Visual management of this kind comes straight from lean manufacturing. The most sophisticated OEE tracking system delivers no value if operators don’t see or act on the data. Display real-time OEE scores on monitors at each production line. Include OEE review in daily production huddles. When downtime occurs, empower operators to log the specific reason immediately rather than guessing hours later. This creates ownership at the frontline level where most improvement opportunities exist.
5. Connect OEE to Production Planning
OEE tracked in isolation provides limited strategic value, and it is only one of the numbers worth watching (see our overview of essential manufacturing KPIs). The most effective manufacturers connect OEE data to production planning, inventory management, and cost accounting. Production management software like Controlata incorporates equipment effectiveness data into capacity calculations, automatically adjusting production schedules when OEE falls below targets and providing realistic delivery date commitments based on actual equipment performance rather than theoretical capacity. This integration ensures OEE improvement translates directly to better customer service and operational predictability.
Common OEE Implementation Challenges
Even manufacturers convinced of OEE’s value encounter obstacles when implementing tracking and improvement programs. Understanding these challenges in advance accelerates successful deployment.
Data Collection
Legacy equipment often lacks sensors or connectivity for automatic data capture. Manual tracking introduces errors, inconsistencies across shifts, and delayed visibility that undermines real-time response. Retrofitting older machines with IoT sensors provides one solution, though upfront cost can be prohibitive. An alternative approach focuses on tracking OEE for critical bottleneck equipment first using manual methods, then expanding to full automation as budget allows. Imperfect data tracked consistently beats perfect data collected sporadically.
Organizational Resistance
Production teams sometimes view efficiency metrics as tools for blame rather than improvement. This fear is not unfounded. If management uses low OEE scores to punish operators rather than identify systemic problems, participation will be minimal and data will be unreliable. Successful OEE programs communicate explicitly that the goal is process improvement, not performance evaluation of individuals. Celebrate teams that identify and fix problems, regardless of initial OEE scores.
Setting the Right Targets
The instinct to maximize OEE on every machine creates suboptimal results. Non-bottleneck resources should not run at maximum OEE if doing so builds excess inventory or starves downstream processes. Theory of Constraints teaches that system throughput depends on the bottleneck constraint. OEE improvement efforts should concentrate on bottleneck resources first. Once bottleneck OEE improves sufficiently that a different resource becomes the constraint, shift focus accordingly.
Sustaining the Gains
Many improvement programs achieve impressive short-term results that fade within months. Sustaining improvement requires making OEE review part of standard daily management. This might include OEE scorecards at shift handoff meetings, weekly trend analysis with production supervisors, and monthly deep dives into persistent loss patterns. Without these routines, teams revert to old habits and hard-won gains disappear.
Conclusion
Overall Equipment Effectiveness transforms manufacturing from reactive firefighting to proactive optimization. By breaking down complex production losses into three measurable components, OEE provides the diagnostic clarity needed to target improvement efforts where they matter most. The gap between typical performance (60% OEE) and world-class (85% OEE) represents enormous untapped capacity in most facilities.
Start simple rather than perfect. Select one production line, measure OEE manually for two weeks, and identify the single largest loss category. Address that loss, measure again, and repeat. As the discipline builds, expand tracking to additional equipment and integrate OEE data with production planning systems. Modern manufacturing platforms like Controlata make this integration straightforward by connecting equipment effectiveness directly to capacity planning, cost accounting, and delivery scheduling.
The manufacturers who master OEE measurement and improvement will outperform competitors by producing more with existing assets, delivering orders more reliably, and responding faster to demand changes. Begin measuring today.