Work in Progress (WIP) Inventory: Management Guide for Manufacturers

For many manufacturers, work in progress inventory is the silent cash drain hiding in plain sight. While raw materials and finished goods get regular attention, the partially completed products sitting on your production floor quietly tie up thousands or even millions of dollars in working capital. Every unfinished unit represents cash locked away, unavailable for growth, equipment upgrades, or meeting payroll during slow periods.
Work in progress (WIP) inventory consists of all partially completed goods moving through your production process between raw materials and finished products. Managing it effectively is not just an operational concern — it directly impacts your cash flow, production efficiency, and bottom-line profitability.
This guide breaks down everything you need to know about WIP inventory management: what it is, how to calculate it accurately, why excess WIP drains your cash, and five proven strategies to reduce it and free up working capital.
What is Work in Progress (WIP) Inventory?
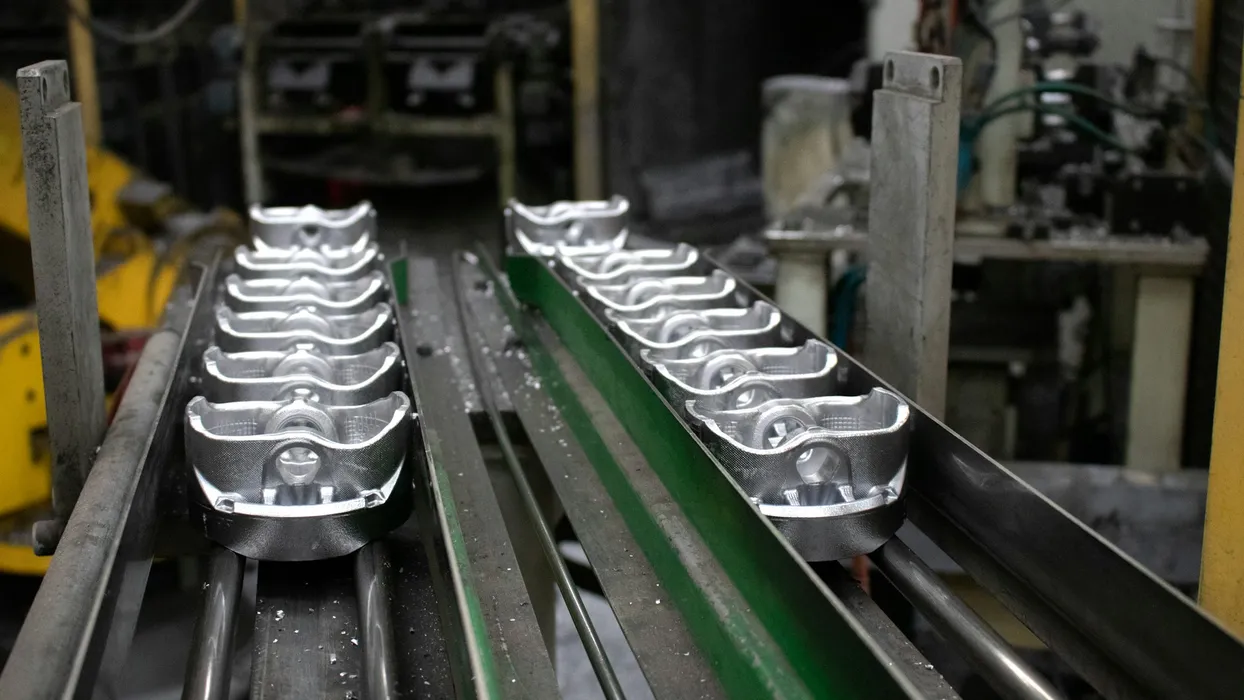
Work in progress inventory refers to all materials and products currently being manufactured but not yet completed. These items have moved beyond the raw material stage and are undergoing transformation into finished goods, but are not yet ready for sale or shipment to customers.
WIP inventory sits at the intermediate stage of your manufacturing cycle:
- Raw materials: Unprocessed inputs sitting in your warehouse (steel sheets, fabric rolls, electronic components)
- Work in progress: Materials that workers have begun processing (partially welded frames, cut fabric pieces, assembled circuit boards)
- Finished goods: Completed products ready for sale (fully assembled chairs, packaged garments, tested electronic devices)
From an accounting perspective, WIP inventory is classified as a current asset on your balance sheet. Its value includes all costs incurred up to the current stage of production: raw materials consumed, direct labor hours worked, and a portion of manufacturing overhead (utilities, equipment depreciation, factory rent).
Consider these real-world examples:
- Automotive assembly: A partially assembled vehicle on the production line with the engine installed but missing doors and interior components
- Electronics manufacturing: Circuit boards that have been populated with components but have not yet been tested and encased
- Food production: Dough that has been mixed and shaped but is still rising before baking
- Furniture making: Chair frames that have been cut and sanded but not yet assembled, stained, or finished
Note on terminology: You might see “work in process” and “work in progress” used interchangeably. Both terms describe the same concept. In manufacturing, “work in process” typically refers to goods with shorter production cycles (days or weeks), while “work in progress” often describes items with longer cycles (weeks or months), such as construction projects. For practical purposes, the distinction matters little — both represent partially completed inventory.
Why WIP Inventory Management Matters
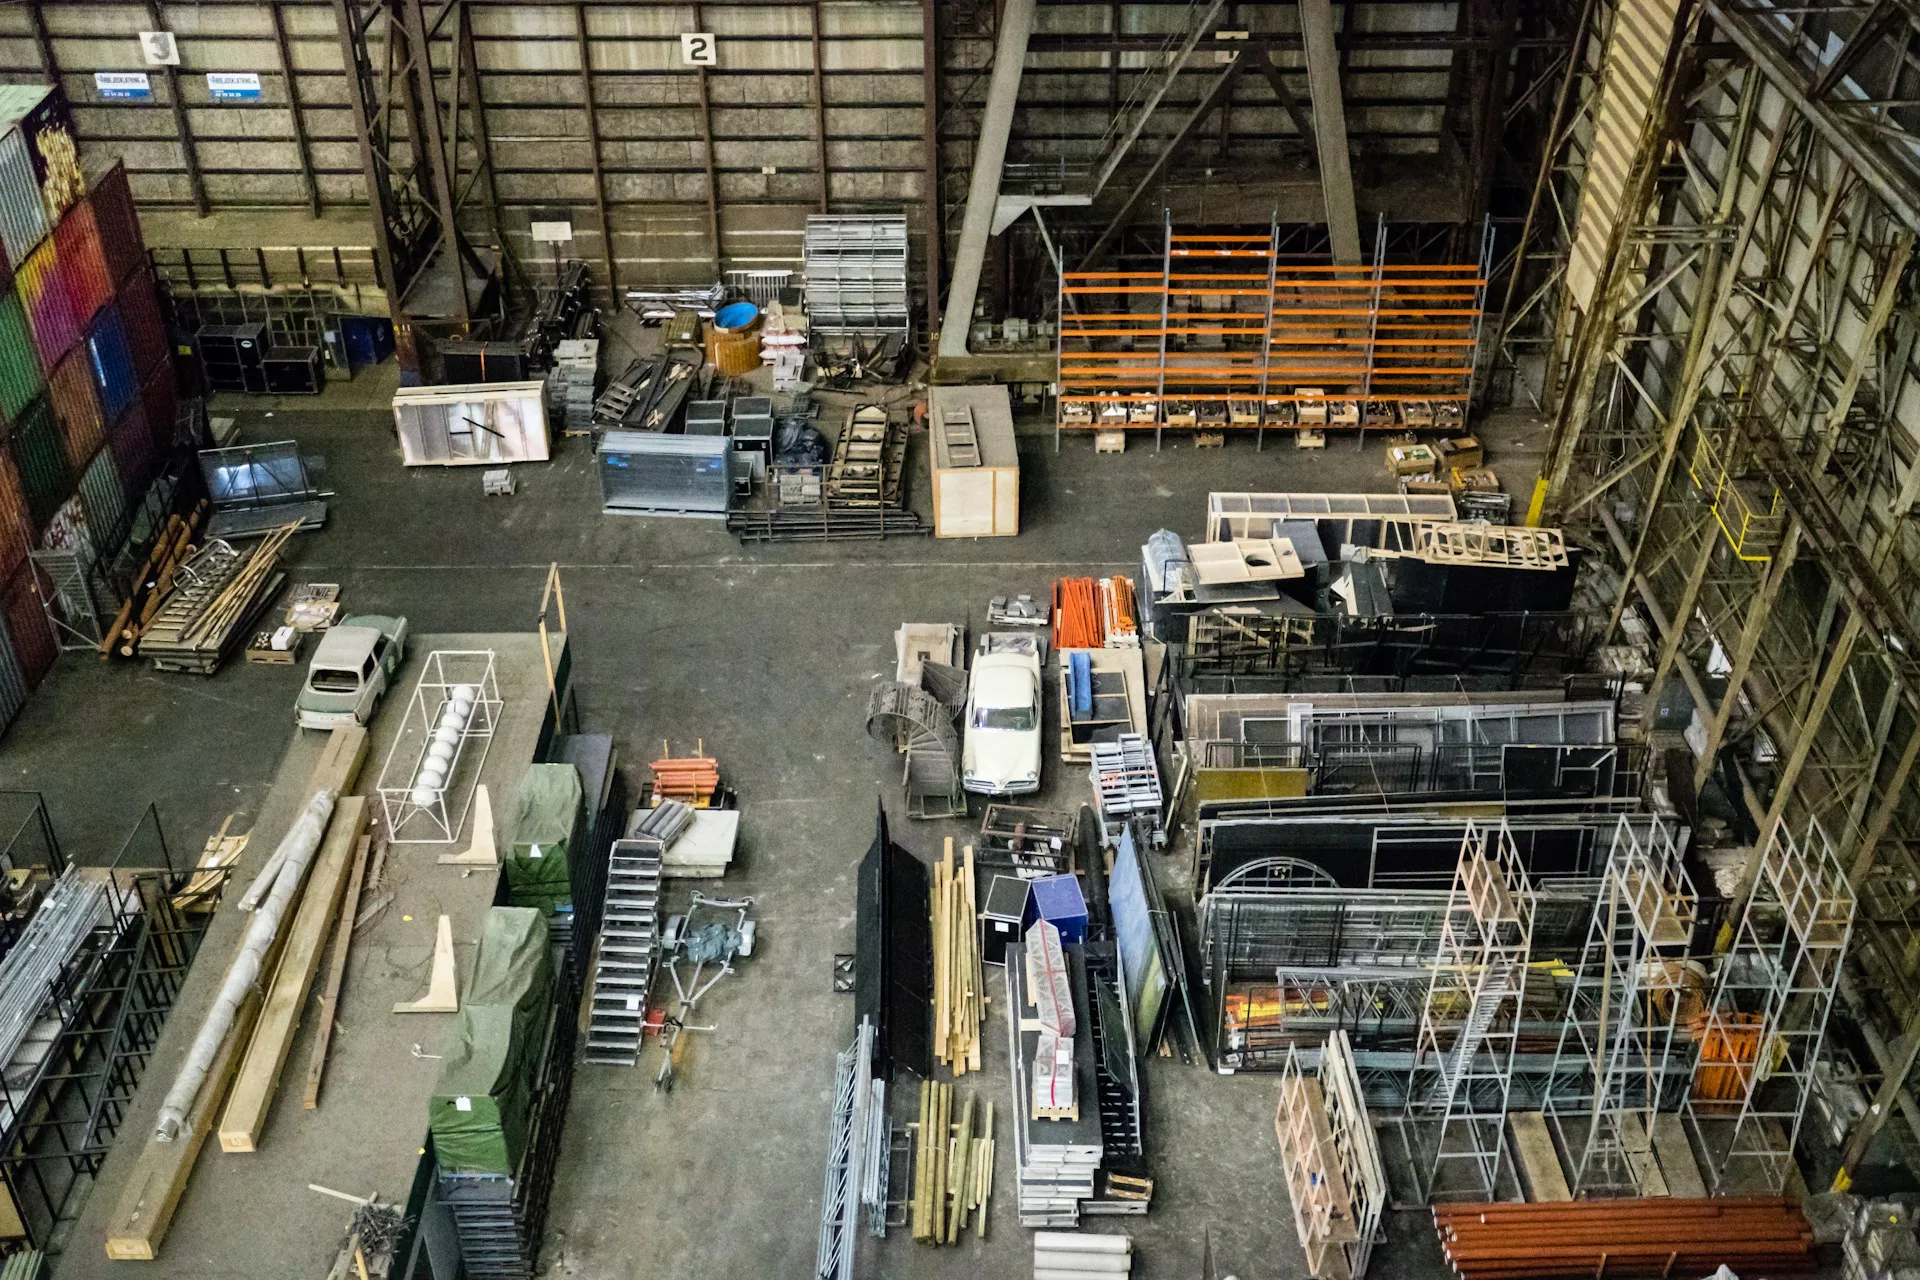
Effective WIP inventory management is critical for manufacturing success, impacting everything from cash availability to customer satisfaction. Neglecting this area creates ripple effects throughout your entire operation.
Cash Flow and Working Capital Impact
WIP inventory represents cash tied up in your production process. Every partially completed unit has already consumed raw materials, labor hours, and overhead costs, but generates no revenue until it reaches the finished goods stage and gets sold.
The financial impact is substantial. According to a study published by manufacturing.net, even in well-run companies, anywhere from 20% to 30% of inventory is dead or obsolete. When WIP accumulates excessively, you are essentially parking cash on your production floor instead of investing it in growth opportunities, equipment upgrades, or maintaining healthy reserves for unexpected expenses.
For businesses operating on thin margins or managing seasonal demand fluctuations, excessive WIP can strain working capital to dangerous levels, forcing reliance on expensive short-term borrowing or delaying critical supplier payments.
Production Efficiency and Bottleneck Visibility
WIP levels serve as a diagnostic tool for your manufacturing process. High WIP accumulation at specific production stages signals bottlenecks, inefficient workflows, or equipment issues that slow overall throughput.
When you track WIP by production stage, patterns emerge quickly. If partially assembled products consistently pile up before final quality inspection, you might need additional inspection capacity or streamlined testing procedures. If WIP accumulates before a specific machining operation, that machine might be undersized for your current production volume.
Cost Visibility and Accuracy
Accurate WIP tracking ensures your cost of goods sold (COGS) calculations reflect reality. Without proper WIP accounting, you cannot determine true product costs or profit margins. This impacts pricing decisions, customer profitability analysis, and financial reporting accuracy.
WIP tracking captures labor hours applied to specific batches, materials consumed at each production stage, and overhead allocation. This granular cost data helps identify where expenses deviate from standards and where efficiency improvements offer the biggest return.
Financial Reporting Requirements
From an accounting standpoint, WIP inventory must be accurately valued and reported on your balance sheet. Incorrect WIP valuation distorts your current assets, affects key financial ratios that lenders and investors scrutinize, and can trigger compliance issues if your business undergoes audits.
Customer Satisfaction and Delivery Reliability
When you maintain visibility into WIP inventory levels and production progress, you can provide customers with accurate delivery estimates and proactively communicate about potential delays. This transparency builds trust and strengthens relationships.
Conversely, excessive WIP often indicates chaotic production scheduling, making it nearly impossible to predict when orders will actually ship. Customers value reliability, and consistent missed delivery dates damage reputation and customer lifetime value.
Try Controlata
- Manufacturing inventory management
- Cost calculation
- Production planning
- And much more

How to Calculate WIP Inventory
Calculating WIP inventory accurately is essential for financial reporting and operational decision-making. The standard formula provides the value of partially completed goods at the end of an accounting period.
WIP Inventory Formula:
Ending WIP Inventory = Beginning WIP Inventory + Manufacturing Costs - Cost of Goods Manufactured (COGM)
Let me break down each component:
Beginning WIP Inventory
This represents the value of all partially completed goods at the start of your accounting period. For ongoing operations, this number comes from the ending WIP inventory of the previous period. For new manufacturers or first-time calculations, this value starts at zero.
Manufacturing Costs
Manufacturing costs include all expenses incurred during the period to produce goods:
- Raw materials used: The value of all materials consumed in production (calculated as beginning raw materials inventory, plus purchases, minus ending raw materials inventory)
- Direct labor costs: Wages paid to workers directly involved in manufacturing (machine operators, assemblers, quality inspectors)
- Manufacturing overhead: All other production-related costs, including utilities, equipment depreciation, factory rent, maintenance, and indirect labor (supervisors, material handlers)
Cost of Goods Manufactured (COGM)
COGM represents the total value of goods completed during the period and moved from WIP to finished goods inventory. This is calculated by adding beginning WIP inventory and manufacturing costs, then subtracting ending WIP inventory.
Practical Example
Consider a furniture manufacturer producing office desks:
- Beginning WIP Inventory: $15,000 (desks in various stages of completion from last month)
- Manufacturing Costs for the month:
- Raw materials used: $45,000 (wood, hardware, finishes)
- Direct labor: $22,000 (assembly workers, finishing specialists)
- Manufacturing overhead: $13,000 (utilities, equipment depreciation, factory rent)
- Total manufacturing costs: $80,000
During the month, the company completed desks valued at $78,000, which moved to finished goods inventory.
Using the formula:
Ending WIP Inventory = $15,000 + $80,000 - $78,000 = $17,000
At month-end, the furniture manufacturer has $17,000 worth of partially completed desks still in production.
Why Accurate Calculation Matters
Precise WIP calculations are critical for several reasons:
- Financial statement accuracy: Your balance sheet must reflect true asset values
- Tax compliance: Incorrect inventory valuation can trigger tax penalties
- Cost analysis: Understanding true production costs enables better pricing decisions
- Performance tracking: Monitoring WIP trends over time reveals efficiency improvements or deterioration
Many manufacturers conduct physical WIP counts at period-end to verify calculated values, especially in job-shop or batch production environments where WIP can be complex to track.
The Hidden Cost of Excess WIP

While most manufacturers understand that WIP represents tied-up cash, few quantify the actual financial impact on their business. The connection between WIP levels and working capital health is direct and measurable.
WIP and the Cash Conversion Cycle
Every dollar invested in WIP is a dollar unavailable for other business needs. The longer materials sit in production, the longer your cash remains locked away. This concept is captured in the cash conversion cycle, which measures how many days it takes to convert inventory investments back into cash through sales.
Consider this simple calculation: If your WIP inventory is valued at $500,000 and your daily cost of goods sold is $10,000, that represents 50 days of cash tied up in partially completed goods. For a small or mid-sized manufacturer, this could easily represent the equivalent of one or two months of operating expenses sitting idle on the production floor.
WIP Turnover Ratio: The Key Performance Metric
The WIP turnover ratio measures how efficiently you convert work in progress into finished goods. It is calculated as:
WIP Turnover Ratio = Cost of Goods Sold / Average WIP Inventory
Higher turnover indicates faster production cycles and more efficient capital use. According to Netstock’s analysis of 2,400+ manufacturing SMBs, manufacturing businesses average around 5.3 total inventory turns annually. However, top performers in specific manufacturing segments achieve significantly higher rates by optimizing production flow and minimizing WIP accumulation.
What constitutes “good” WIP turnover varies by industry:
- Make-to-order electronics: 15-25 turns (production cycles measured in days)
- Furniture manufacturing: 6-12 turns (multi-week production cycles)
- Heavy machinery: 3-6 turns (long production cycles with complex assembly)
If your WIP turnover is significantly below industry benchmarks, you are likely experiencing one or more of these issues: production bottlenecks, oversized batch production, poor production scheduling, or quality problems causing rework.
The Real Dollar Impact
Here is where the cash flow impact becomes tangible. Let us say your business has:
- Annual COGS: $3,000,000
- Current WIP inventory: $600,000
- Current WIP turnover: 5 times per year
Now imagine you implement improvements that increase WIP turnover to 7.5 times per year (a 50% improvement, which is achievable with focused effort):
- New average WIP inventory: $3,000,000 ÷ 7.5 = $400,000
- Cash freed up: $600,000 - $400,000 = $200,000
That $200,000 can now be deployed for growth initiatives, debt reduction, emergency reserves, or simply reducing the need for expensive lines of credit. For many small manufacturers, this represents a game-changing improvement in financial flexibility.
Working Capital Liberation
Manufacturing businesses typically operate with thin working capital margins. According to a PYMTS survey, 73% of executives reported that accounts payable automation improves cash flow. The same principle applies to WIP reduction: when you accelerate production cycles and reduce WIP levels, you free up cash that was previously locked in partially completed inventory.
This freed capital improves your current ratio (current assets divided by current liabilities), strengthens your negotiating position with suppliers and lenders, and provides breathing room during seasonal demand fluctuations or unexpected market disruptions.
The bottom line: Every percentage point reduction in WIP translates directly to improved cash availability. For businesses experiencing working capital stress, WIP reduction often provides the fastest path to relief.
5 Strategies to Reduce WIP Inventory
Reducing WIP inventory requires a systematic approach targeting the root causes of accumulation. These five strategies have proven effective across diverse manufacturing environments.
1. Identify and Eliminate Bottlenecks
Production bottlenecks create upstream WIP accumulation as materials pile up waiting for the constrained resource. Start by mapping your complete production flow, documenting cycle times at each stage. WIP will naturally accumulate immediately before your bottleneck operation.
Once identified, address bottlenecks through:
- Capacity additions: Adding equipment or shifts for the constrained operation
- Process improvements: Reducing changeover time or improving efficiency at the bottleneck
- Work redistribution: Moving some operations to underutilized equipment or outsourcing
- Quality improvements: Reducing defects that require rework through the bottleneck
Track WIP levels by production stage weekly. When accumulation patterns shift, you have identified where your true constraint lies.
2. Implement Pull-Based Production Systems
Traditional push-based manufacturing starts production based on forecasts, often creating WIP that sits idle when actual demand differs from predictions. Pull-based systems like Kanban flip this model: production at each stage only begins when the downstream operation signals it is ready to receive work.
Kanban implementation basics:
- Set maximum WIP limits for each production stage (for example, maximum 20 units between welding and painting)
- Use visual signals (cards, bins, or digital dashboards) to communicate when downstream operations are ready for more work
- Halt upstream production when WIP limits are reached
This approach naturally constrains WIP accumulation and forces attention on bottleneck resolution. Toyota pioneered this method and demonstrated that pull systems can reduce WIP by 50% or more while maintaining or improving throughput.
3. Standardize and Balance Production Processes
Variability in production cycle times creates WIP accumulation. If one operation takes 10 minutes one day and 25 minutes the next, you cannot reliably predict flow, and you need WIP buffers to prevent downstream starvation.
Focus on standardization:
- Document best practices: Create standard work instructions for each operation
- Cross-train workers: Ensure multiple employees can perform each operation competently
- Balance line rates: Adjust staffing or equipment to ensure similar cycle times across sequential operations
Calculate takt time (available production time divided by customer demand) and design each operation to complete within that time window. This balancing eliminates the fast operations that race ahead, creating WIP, and slow operations that starve downstream processes.
4. Leverage Real-Time Visibility Through Technology
You cannot manage what you cannot see, which is why production management software has become the baseline rather than a luxury. Modern manufacturing operations increasingly rely on technology for real-time WIP tracking:
- Barcode or RFID scanning: Track each batch or unit as it moves between operations
- IoT sensors: Automatically capture production events (operation start, completion, quality checks)
- Manufacturing execution systems (MES): Provide dashboards showing current WIP levels by stage, batch status, and production velocity
Research by Aiwyn demonstrates that companies automating their inventory and production processes report 25% to 30% reductions in days sales outstanding and similar improvements in inventory turnover.
Real-time visibility enables rapid response. When WIP begins accumulating at a specific stage, you can immediately investigate and take corrective action rather than discovering the problem days later during a physical count.
5. Optimize Batch Sizes
Traditional economic order quantity (EOQ) models often push manufacturers toward large batches to spread setup costs across more units. However, large batches create large WIP levels.
The trade-off is real: smaller batches mean more frequent changeovers, but also faster flow, lower WIP, and greater flexibility to respond to demand changes. The key is reducing setup time to the point where smaller batches become economically viable.
Quick changeover techniques (SMED: Single-Minute Exchange of Dies):
- Convert internal setup steps (must be done while machine is stopped) to external steps (done while machine runs)
- Standardize tooling and fixtures to reduce adjustment time
- Create setup checklists and stage all needed materials before stopping production
Many manufacturers discover that reducing setup time from 2 hours to 20 minutes makes batch sizes of 50 units more economical than the previous batches of 500 units, cutting WIP by 90% with negligible impact on per-unit costs.
Best Practices for WIP Management
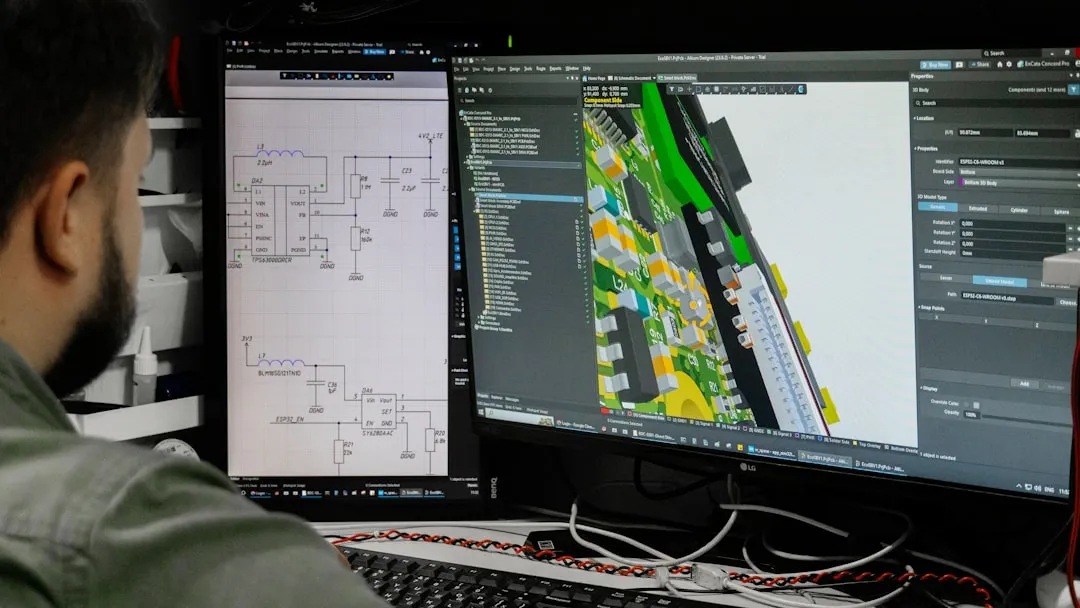
Beyond specific reduction strategies, successful WIP management requires ongoing discipline and systematic practices embedded into your operations.
Conduct Regular Physical Counts
Do not rely solely on your system records. Schedule regular cycle counts of WIP inventory, particularly at critical production stages. Physical counts reveal discrepancies between actual and recorded inventory, identify missing or damaged items, and provide early warning of tracking failures. Monthly counts for high-value WIP and quarterly counts for lower-value work in progress strike a good balance for most manufacturers.
Set WIP Limits by Production Stage
Establish maximum WIP levels for each production stage based on your throughput requirements and constraint capacity. High WIP is usually a symptom of a long manufacturing lead time, so treat the two metrics together. When WIP approaches these limits, investigate immediately. These limits function as early warning indicators that something in your process has changed and needs attention.
Monitor WIP Turnover Monthly
Track your WIP turnover ratio as a key performance indicator, reviewing it at least monthly alongside the ratios in our guide to finished goods inventory management. Calculate it consistently (same method, same accounting period) so trends are meaningful. When turnover deteriorates, drill into which production stages are accumulating inventory and why.
Invest in Manufacturing Software
Manual WIP tracking using spreadsheets breaks down as production complexity increases. Manufacturing resource planning (MRP) or production management software automates tracking, provides real-time visibility, and integrates with your accounting system for seamless financial reporting.
Modern systems like Controlata are designed specifically for small and mid-sized manufacturers, offering bill of materials tracking, automatic inventory updates, and real-time visibility into work in progress levels across your entire production flow.
Align Production Schedules with Actual Demand
Review your production schedule frequently (daily for high-volume operations, weekly for job shops) and adjust based on actual customer orders and near-term forecasts. Starting production too early creates WIP that sits waiting for its ship date. Starting too late creates expediting chaos and quality issues from rushed work.
Foster Cross-Functional Collaboration
WIP reduction requires coordination between procurement (material availability), production (execution), and sales (demand visibility). Establish regular communication rhythms where these teams review upcoming production needs, potential constraints, and priority changes. When everyone works from the same plan, WIP naturally stays lower.
Embrace Continuous Improvement
Make WIP reduction part of your continuous improvement culture. Small, incremental improvements compound over time. A 2% reduction in average production cycle time each month results in a 25% improvement within a year. Engage production workers in identifying waste and suggesting improvements. They see inefficiencies every day that management overlooks.
Conclusion
Work in progress inventory is more than an accounting entry on your balance sheet. It is a window into your production efficiency and a major driver of cash flow health. Manufacturers who effectively manage WIP free up working capital, reduce production lead times, and build more predictable, profitable operations.
Start by measuring your current state: calculate your WIP inventory value and turnover ratio. Identify where WIP accumulates in your production process. Then systematically apply the strategies in this guide to reduce waste, improve flow, and convert tied-up cash back into financial flexibility. Even small improvements compound quickly. A 10% reduction in WIP can free up tens of thousands of dollars in working capital for growth, equipment investment, or simply breathing room during challenging periods.
Manufacturing success is built on operational discipline and continuous improvement. Effective WIP management is a cornerstone of both.